What networks are we looking at here? #
This website currently hosts one network, which displays the state of media ownership in 2022. In this case we mainly wanted to highlight the most influential owners, which determined our choices of the default settings of the graph.
Edges #
The graph(s) are directed. in order to display the direction of ownership. The source nodes are the owners of the target nodes.
The thicknes of the edges is determined by the ownership stake. Thicker red lines mark a greater degree of influence, theoretically. For example, the image below shows that Infonet Media has a larger stake in Radio Kranj than Radio Belvi.
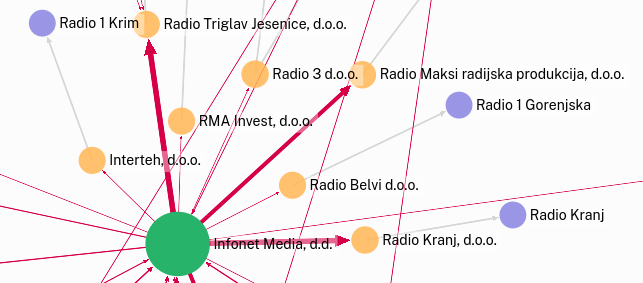
In some cases we have data which confirms that one entity owns another, but none that would provide exact information about the ownership stake. This is marked by grey edges.
Nodes #
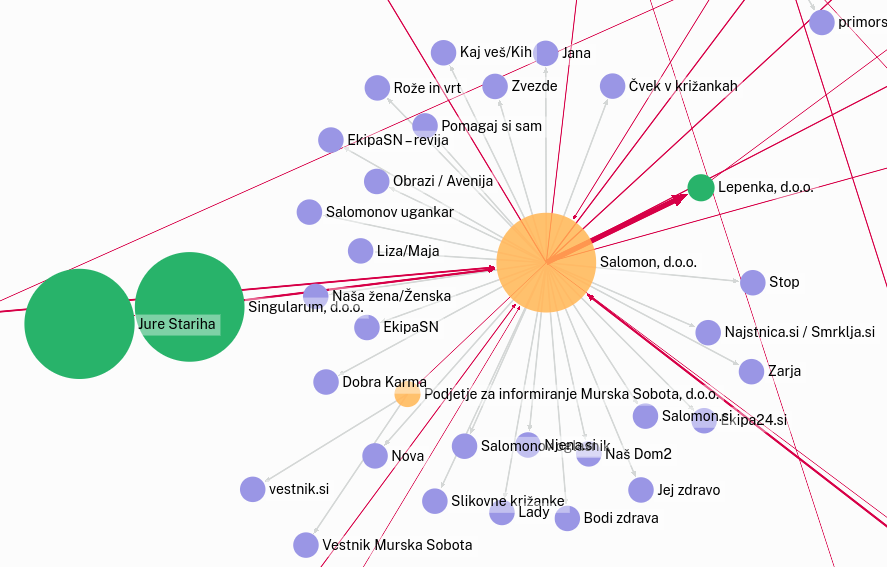
The size of a node is determined by the number of outgoing connections that node has. The number of outgoing connections is not calculated on the basis of immediate neighbours only (standard out-degree), but encompasses all unbroken chains of outgoing connections starting at a node. This provides us with a clearer view of the relative influence of different owners. In the example below - which uses the standard out-degree metric - Jure Stariha seems unimportant, since he only owns one company - Singularum d.o.o.

However, if we extend the calculation, it becomes obvious that - through his ownership of Singularum d.o.o. - he controls a portion of Salomon d.o.o., which publishes a very lagre number of publications. Adding the out-degrees of Signularum d.o.o. and Salomon d.o.o. to Jure Stariha and basing the size of his node on that value, reflects his role in the network much more adequatly.
This means that the default settings highlight those owners which have a stake in a large number of organizations, directly or thourgh intermediaries.
Like every perspective this one has certain blind spots too. The number of media someone owns can only be a relatively good proxy measure of their influence. The number itself matters less if the media in question have a relatively small cumulative reach. Someone owning one media outlet with a large reach and turnover can be considered more relevant in this regard.
Fortunately the interactive features of the graphs on this website allow us to change focus. More on that in the next section.
Usage instructions #
Every graph is accompanied by a legend, which relates to the default settings. These can be changed in the graph settings, which open with a click on this button  in the upper left corner.
There you can execute three main operations:
- you can filter the graph according to the value the available variables;
- you can choose what determines the size and colour of nodes;
- you can find nodes based on their name.
Some additional options are available if you open the graph in a separate window  . This takes you to the website of Retina, the FOSS tool we use to display these graphs.
You can also open the graph with Gephi Lite, which is even more advanced in terms of features and capabilities, but requires some knowledge of network analysis.
Gephi Lite supports the display of edge labels, which we use to display ownership stakes.
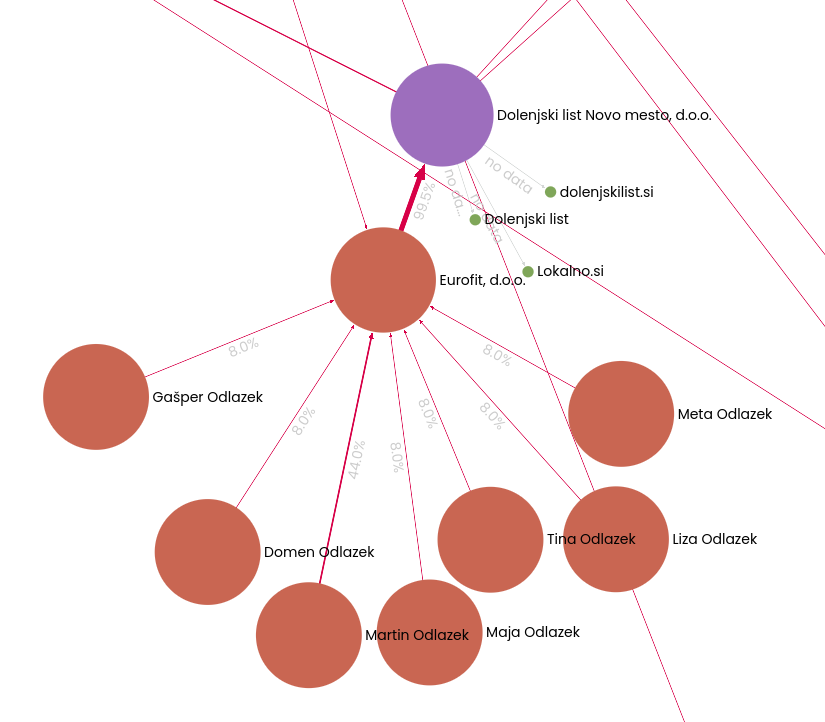 Gephi Lite - Prikaz lastniških deležev