The procedure #
Collecting data #
The analysis focuses on media concentration across various sectors (print, television, radio, and online) in Slovenia, tracing the ownership patterns of both regional and global media companies. To create a sample of media outlets that served as a starting point for further research on specific companies and ownership connections, we included outlets that exceeded an audience reach threshold of 3% in three sectors: print media, television, and online media. Audience reach data were collected by three distinct agencies in Slovenia implementing standardized audience measurements: Mediana for print media readership, AGB Nielsen for television viewership, and MOSS, an advertising agency, for online media audiences. The sampling unit is the media outlet rather than the media company, since a single publisher or media company may broadcast, print, or own multiple outlets.
We then identified the publishers of all media outlets in the database by consulting the national media registry (in Slovene: Razvid medijev) maintained by the Slovenian Ministry of Culture. To ensure the accuracy of this information, we used the Wayback Machine tool to verify the publisher of a specific media outlet on its website for the year 2022. Finally, data on ownership shares for each media publisher were obtained from the GVIN database, a corporate database that primarily draws on data from AJPES, which is managed by the Agency of the Republic of Slovenia for Public Legal Records and Services.
Sources of data #
-
Reach of printed media: Mediana (accessed 1 Feb. 2024 – 29 Feb. 2024)
Source: https://www.mediana.si/aktualni-podatki-o-branosti-tiskanih-medijev-mediana-tgi-2022/ -
Reach of online media: MOSS, Merjenje obiskanosti spletnih strani (accessed 1 Feb. 2024 – 29 Feb. 2024)
Source: https://www.moss-soz.si/rezultati/ -
Reach of TV programmes: AGB Nielsen Medijske raziskave (data included a list of TV programmes exceeding the threshold of 3%, not specific information on reach) (accessed 11 Mar. 2024)
Source: https://www.nielsen.com/about-us/locations/slovenia/ -
Information about publishers: Razvid medijev (accessed 29 Feb. 2024 – 31 Mar. 2024)
Source: https://remk.ekultura.gov.si/razvid/mediji -
Ownership of NTV24.si, d. d.: eBonitete (accessed 31 Mar. 2024)
Source: https://www.ebonitete.si/ -
Ownership of NTV24.si, d. d.: eBonitete (accessed 31 Mar. 2024)
Source: https://gvin.com
Preparing data #
The collected data had to be cleaned and refined so we could perform network analysis on it. The code we used for that purpose is published in the code repository of The Peace Institute.
Most data wragnling operations have/had to do with joining separate excel tables, the standardisation of non-existing data points and the renaming of variables. This then allowed us perform our analysis in Gephi and/or with Networkx.
All ownership stakes below 1% were rounded up to 1% for the purposes to improve the display in Gephi and Retina. A wider maximum range (say 0,1%-100%) between the lowest and highest ownership stake values created edges, which were either too thin or to thick to be legible.
In cases where the ownership databases showed that some entity was an owner of another entity, but not to what extent, we have defaulted to the ownership stake of 25%. An even better solution would be to evenly distribute the ownership stakes based on the number of owners.
The turnovers (in EUR) of media companies were adjusted for inflation based on the calculator/data from SURS (Statistical office of the Republic of Slovenia). They are expressed in 2025 values.
Analysing data #
We have performed some basic network analysis calculations (degree, in-degree, out degree) with the Python library Networkx.
Displaying the spread on the influence through the network #
These basic calculations are based on the connections a node has to its immediate neighbours, which not enough in networks, where ownership is organized via longer chains od intermediaries.
To highlight these chains of influence we have performed some more advanced calculations. These are explained in greated detail in the chapter on networks using the example of cumulative out-degrees.
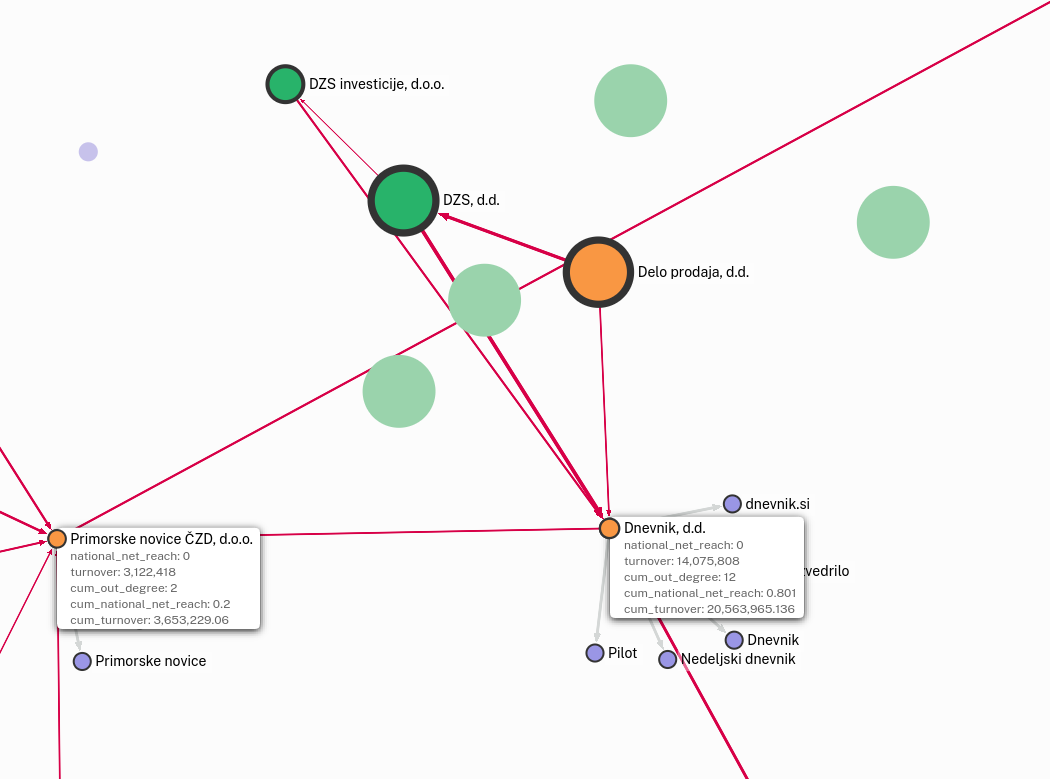
In addition to cumulative out degrees we have calculated cumulative turnovers and the cumulative national net reach (for online and print media). These operations move turnover and reach values up ownership chains and apply weights based on ownership stakes. So an owner of a 10% ownership stake in a media company will accumulate 10% of that companies budget under its cum_turnover variable.
In the example below Dnevnik, d.d. accumulates the reach and turnover of all the media it owns directly and indirectly (through Primorske novice ČZD d.o.o.). In the second step Delo prodaja, DZS and DZS investicije split the accumulated turnover (cum_turnover) and reach (cum_national_net_reach) of Dnevnik, d.d. based on their ownership stake.
The code use to perform these calculations is available here in its entirety. You can find the crucial function below.
def calculate_degree_sums(
    edges_df,
    nodes_df,
    property_col_name="Out-Degree",
    output_column_prefix="degree",
    output_file_path="updated_nodes.csv",
    return_updated_df=False,
    write_to_file=False,
    max_depth=None,
    weight_col=None,  # edges_df
):
    """
    Calculate the sum of specified properties up to a certain degree for nodes in a network.

    Parameters:
    - edges_df: DataFrame containing the edges of the network with 'source' and 'target' columns.
    - nodes_df: DataFrame containing the nodes of the network with 'id' and specified property columns.
    - property_col_name: Column name in nodes_df to sum for neighbors.
    - output_column_prefix: Prefix for the output columns in nodes_df.
    - output_file_path: File path to save the updated nodes DataFrame if write_to_file is True.
    - return_updated_df: If True, return the updated nodes DataFrame.
    - write_to_file: If True, save the updated nodes DataFrame to a CSV file.
    - max_depth: Follow outgoing connections for max_depth number of degrees. If None, the code runs till the end of all outgoing connections.

    Returns:
    - Dictionary of summed properties for each node or the updated DataFrame if return_updated_df is True.
    """
    if not {"source", "target"}.issubset(edges_df.columns):
        raise ValueError("Edges file must contain `source` and `target` columns.")
    if not {"id", property_col_name}.issubset(nodes_df.columns):
        raise ValueError(f"Nodes file must contain `id` and `{property_col_name}` columns.")

    nodes_df[property_col_name] = pd.to_numeric(nodes_df[property_col_name], errors="coerce").fillna(0)

    property_dict = nodes_df.set_index("id")[property_col_name].to_dict()
    degree_property_sums = {node: property_dict.get(node, 0) for node in nodes_df["id"]}

    for node in nodes_df["id"]:
        visited = set()
        visited.add(node)  # Mark the starting node as visited
        queue = deque([(node, 0)])  # (node, current_depth)
        while queue:
            current_node, current_depth = queue.popleft()
            if max_depth is not None and current_depth > max_depth:
                continue
            # Add neighbors to the queue and process the edge weights
            neighbors = edges_df[edges_df["source"] == current_node]
            for _, neighbor_row in neighbors.iterrows():
                neighbor = neighbor_row["target"]
                weight = neighbor_row.get(weight_col, 1)  # Default weight is 1 if not specified
                if neighbor not in visited and (max_depth is None or current_depth + 1 <= max_depth):
                    degree_property_sums[node] += property_dict.get(neighbor, 0) * weight
                    visited.add(neighbor)
                    queue.append((neighbor, current_depth + 1))

    if return_updated_df:
        output_column_name = f"{output_column_prefix}_{property_col_name}"
        nodes_df[output_column_name] = nodes_df["id"].map(degree_property_sums)

    if write_to_file:
        nodes_df.to_csv(output_file_path, index=False)
        print(f"Degree property sums calculated and saved to {output_file_path}")

    return degree_property_sums if not return_updated_df else nodes_df